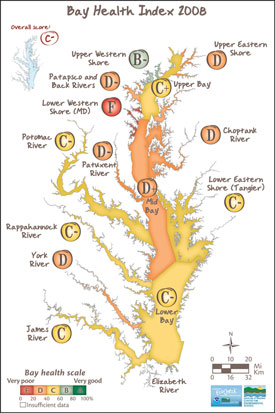
Annapolis, Md. (April 2, 2009) – An independent scientific analysis led by University of Maryland Center for Environmental Science researchers again gives the Chesapeake Bay a C-minus, indicating that Bay ecological conditions have not significantly changed from 2007 and remain far below what is needed for a healthy Bay.
 While the overall lack of improvement is worrisome, scientists are intrigued by new trends showing that over the long-term, improving areas continue to improve while degrading areas continue to degrade.
“These diverging positive and negative trajectories in some of the Bay’s key areas show that there are important ecological feedbacks that come into play once restoration efforts reach a certain level,” said University of Maryland Center for Environmental Science researcher and project leader Dr. William Dennison. “In regions showing signs of improvement, such as Maryland’s Upper Western Shore and Virginia’s James River, restoration efforts appear to be having a positive influence on local ecosystem health and as a result, water quality and biotic health continue to improve. In other tributaries, such as the Magothy, South, Severn, West and Rhode Rivers, nutrient and sediment pollution continue to hamper local ecosystem improvements.”
While the overall health of the Chesapeake Bay in 2008 earned a C-minus, health of the 15 reporting regions varied between locations, ranging from B-minus (moderate-good) to F (very poor). The highest ranked region, for the second year in a row, was the Upper Western Shore, which includes the Bush and Gunpowder Rivers. The lowest ranked region was, for the first time, the Lower Western Shore of Maryland which includes the Magothy, Severn, South, West and Rhode Rivers.
In addition to the annual analysis of the Bay’s tidal waters, scientists for the first time also present a snapshot of ecological conditions in the freshwater streams and rivers that feed the Bay. Data collected at more than 3,200 monitoring sites across the Bay’s drainage basin show that degraded streams are found throughout the watershed, especially in areas with significant urban, agricultural or mining uses.
“The health of local streams is almost always the direct result of how we manage the land around them,” said UMCES stream ecologist and Chesapeake Biological Laboratory Director Dr. Margaret Palmer. “This new watershed-wide look at the health of the Bay’s streams tells us we need to be doing more to protect and restore them. Without healthy streams, we will not be able to have a healthy Bay.”
In addition to the Bay Health Report Card, UMCES researchers worked with local conservation organizations to produce river-specific report cards for the Chester, Patuxent and Severn Rivers. These reports, funded by the Chesapeake Bay Trust and supplemented by data collected by trained volunteers, are designed to provide the organizations with a new set of tools to better explain local environmental health to their communities.
“It’s critical that citizens understand the health of the creeks, streams and rivers that flow through their communities,” said Chesapeake Bay Trust Executive Director Allen Hance. “By supporting report card efforts like these, the Trust hopes to elevate the public’s understanding of how their daily actions can contribute to a healthier Chesapeake Bay.”
Data used in the Chesapeake Bay Health Report Card is collected across the entire Maryland and Virginia portions of the Chesapeake Bay by several state and federal agencies as part of the Chesapeake Bay Program. Report card production is supported by Eco-Check, a NOAA-UMCES partnership.
The University of Maryland Center for Environmental Science is the University System of Maryland’s premier environmental research institution. UMCES researchers are helping improve our scientific understanding of Maryland, the region and the world through its three laboratories – Chesapeake Biological Laboratory in Solomons, Appalachian Laboratory in Frostburg, and Horn Point Laboratory in Cambridge – and the Maryland Sea Grant College in College Park.
For more information about the 2008 Chesapeake Bay Health Report Card including region-specific data and downloadable graphics, visit www.eco-check.org/reportcard/chesapeake/.
# # #

