Chesapeake watershed health assessed for first time
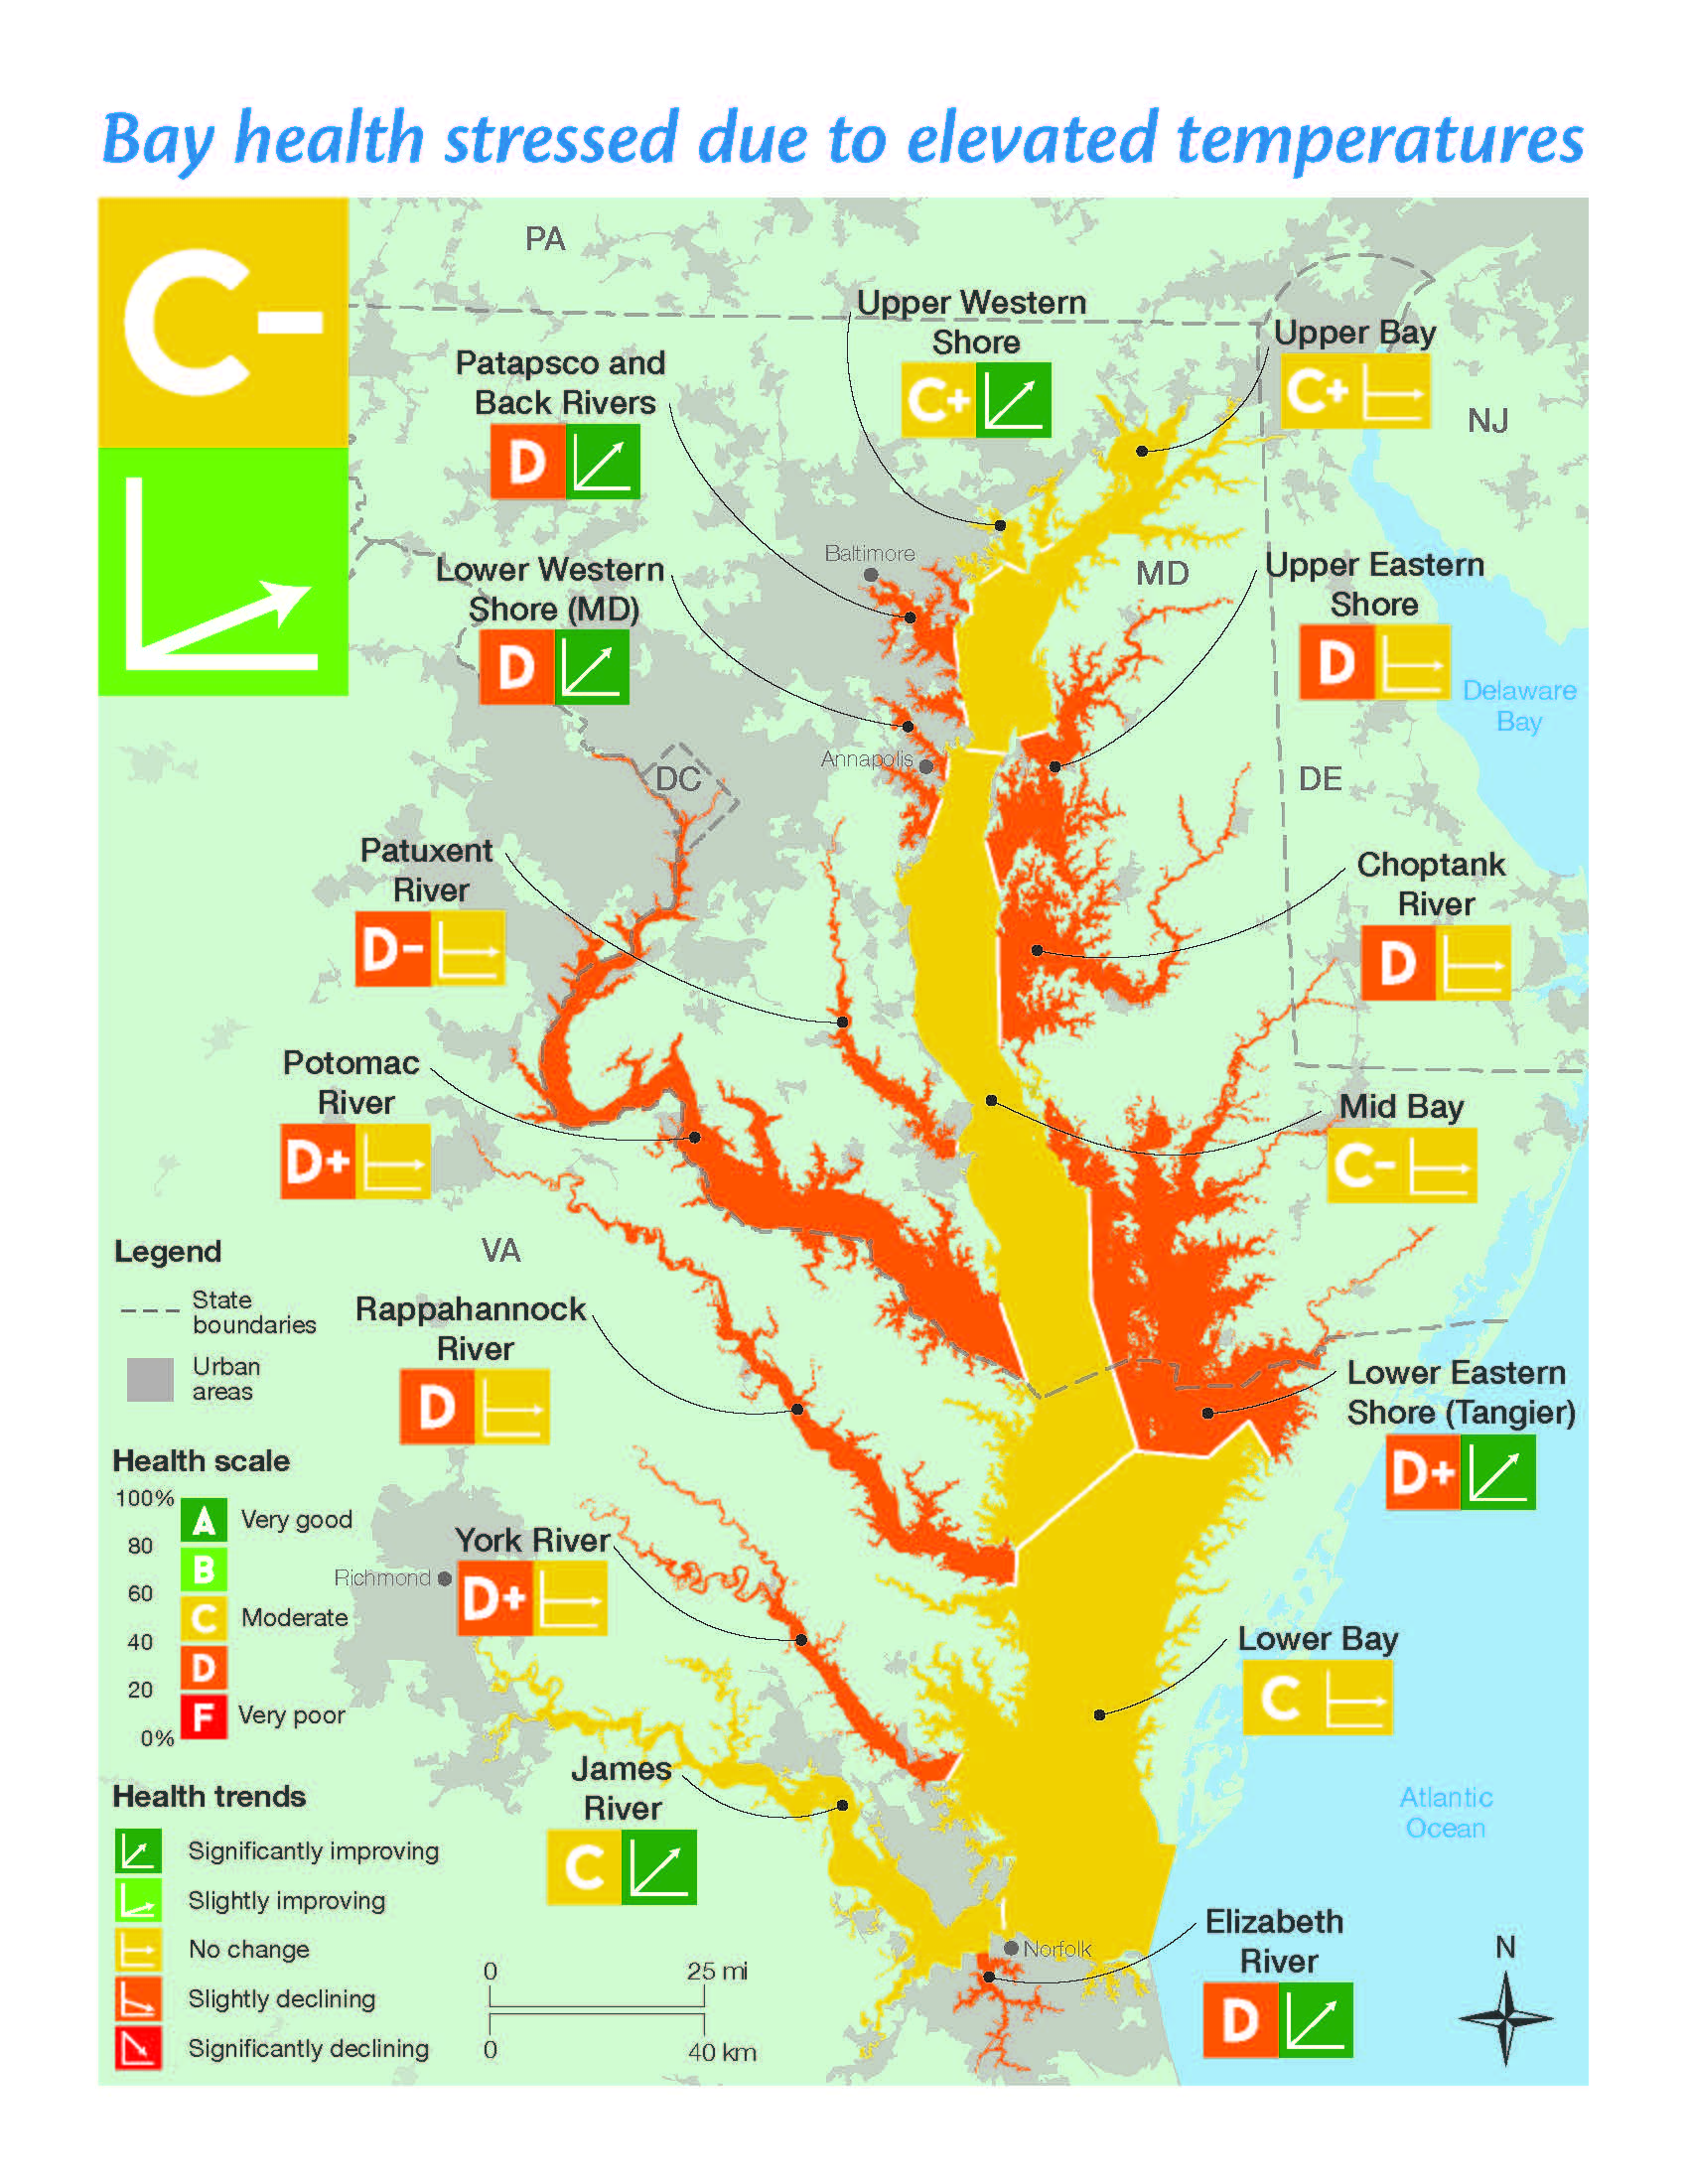
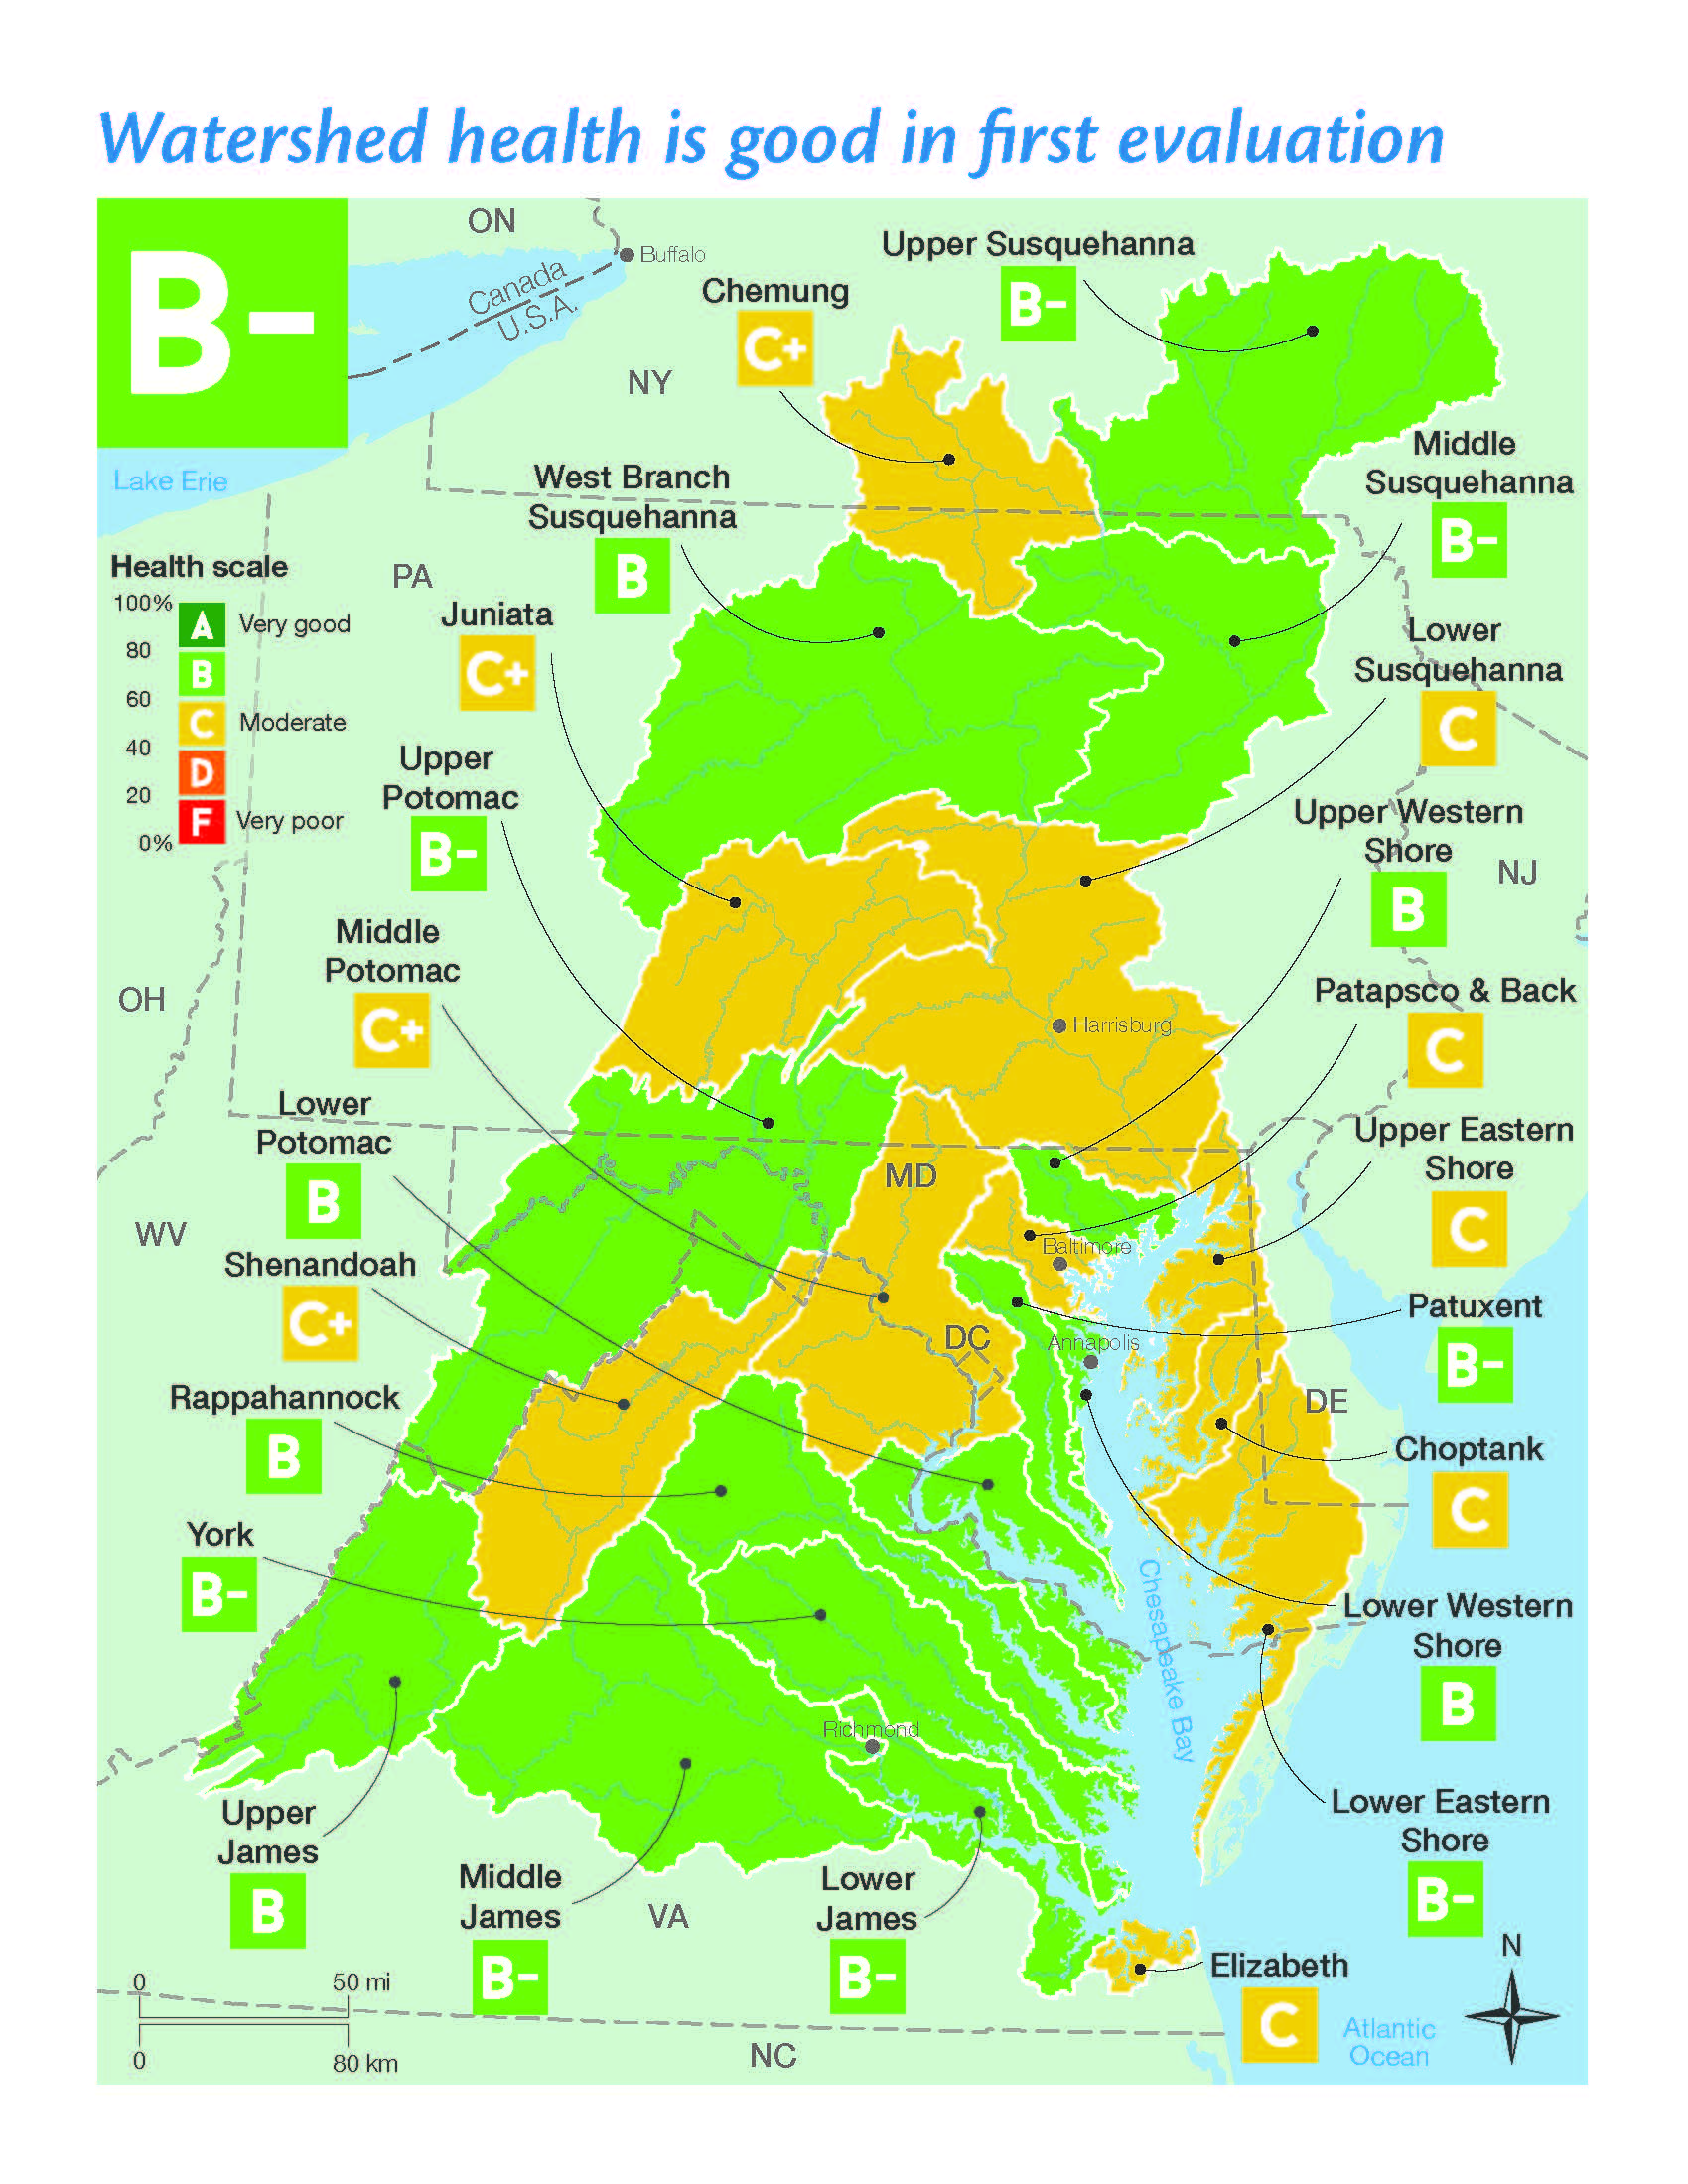
For the first time, Chesapeake Bay watershed health was scored as part of the 2019 Chesapeake Bay Watershed Report Card issued today by the University of Maryland Center for Environmental Science (UMCES). The overall Chesapeake watershed scored a B- grade for 2019. The Chesapeake Bay health score decreased in 2019, dropping from a grade of C to a C-.
The analysis of Chesapeake watershed health uses 23 reporting regions and incorporates both ecological and social indicators in its scores. There are five new watershed health indicators: total nitrogen, total phosphorus, turbidity, stream benthic community, and the social index. Total nitrogen, total phosphorus, and turbidity all had good scores, 79%, 61%, and 68%, respectively. Stream benthic community had a moderate score (46%). The social index scored 60%, a good score.
Past report cards have always used ecological indicators, but this year we incorporated socioeconomic indicators for the first time. The social index is an indicator that uses community vulnerability indices from the Centers for Disease Control and Prevention (CDC). The CDC’s Social Vulnerability Index includes measures of how able a community is to respond and bounce back from hazardous events, such as a natural disaster, tornado, or disease outbreak. Specific measures include data on socioeconomics, household composition and disability, minority status and language, and housing and transportation.
Although the overall Bay health score decreased for the second year in a row, all of the long-term trends for Bay Health remain steady or are positively increasing, according to the 14th annual Chesapeake Bay Watershed Report Card.
“In the last two years the bay was under immense pressure, from extreme runoff due to record high precipitation in 2018 and highly elevated temperatures and intense rain events in 2019. These weather extremes are consistent with climate change predictions,” said Heath Kelsey, Director of the University of Maryland Center for Environmental Science’s Integration and Application Network that produced the report card.
“The Chesapeake is resilient and while the health score fell due to the intense rainfall and elevated temperatures, we are seeing trends that Bay health is still improving over time. We were very encouraged to see many regions in the bay significantly improving. The Upper Bay improved, the Elizabeth River and James River are up, and the Patapsco did much better,” said Bill Dennison, Vice President for Science Application at the University of Maryland Center for Environmental Science. “A good news item is that the James River won the Thiess International River Prize for river basin management in 2019, acknowledging that Chesapeake restoration efforts are being recognized on a global scale.”
Of all the Bay health indicators, the benthic community score was the most affected. Total nitrogen, aquatic grasses, and dissolved oxygen scores also decreased. In 2019, three indicators improved; total phosphorus, chlorophyll a, and water clarity. Overall, the Bay-wide trend is still improving over the long term, as are many regional trends. Since 2014, all regions have been improving or remaining steady. Seven out of 15 regions showed significantly improving health trends, and the long-term trajectory of Bay Health is still positive.
Fish populations received an A grade, showing an improvement from 2018. Blue crab numbers rebounded in 2019, as did the Bay Anchovy population. After last year’s declines in scores, this improvement shows that fish populations are resilient to stress.
"Although the score for the Chesapeake Bay dropped in 2019, it was not unexpected given the weather patterns, particularly the above average temperatures," said Peter Goodwin, President of the University of Maryland Center for Environmental Science and a member of the Maryland Commission on Climate Change. "The Bay is proving to be resilient in the face of climate change due to actions that have already been implemented, but we must redouble our collective efforts to reduce greenhouse gas emissions and protect the Bay.”
In the coming year, more watershed indicators will be incorporated into the report card, including indicators examining protected lands, stewardship, and recreation opportunities. This will allow for a more holistic approach to assessing management of the Chesapeake Bay.
The University of Maryland Center for Environmental Science’s Integration and Application Network produces the annual report card which is the most comprehensive assessment of Chesapeake Bay and its waterways. This report card uses extensive data and analyses and in a partnership with the National Fish and Wildlife Foundation (NFWF), the Chesapeake Bay Program, academic institutions, and watershed jurisdictions. Support from NFWF allows for the expansion to include social and economic indicators across the entire watershed. For more information about the 2019 Chesapeake Bay Watershed Report Card including region-specific data, visit chesapeakebay.ecoreportcard.org.
The views and conclusions contained in this document are those of the authors and should not be interpreted as representing the opinions or policies of the U.S. Government or the National Fish and Wildlife Foundation and its funding sources. Mention of trade names or commercial products does not constitute their endorsement by the U.S. Government, or the National Fish and Wildlife Foundation or its funding sources.


